logotype
  • General Info
    • About project
    • About Us
  • Courses
    • Course 1: What Is Clean Air
    • Course 2: The Effects of Air Pollution on Health
    • Course 3: How does an air quality sensor work
    • Course 4: How do we interpret data from school sensors?
    • Course 5: How to Ventilate a Classroom Properly
    • Course 6: How to Breathe Better Air at School and at Home
    • Course 7: How Our Daily Actions Pollute the Air
    • Course 8: What Is Environmental Responsibility
  • Schools
    • Cluj-Napoca
      • ‘George CoÈ™buc’ National College
      • ‘Tiberiu Popoviciu’ High School of Computer Science
      • ‘Lucian Blaga’ Theoretical High School
      • ‘Iuliu HaÈ›ieganu’ Secondary School
  • Community
    • Recent posts
    • Forums
    • Contact
  • Members
Login
Login
Register
logotype

Lost your password?

Account Details

Profile Details

Name (necesar)

This field can be seen by: Fiecare

  • General Info
    • About project
    • About Us
  • Courses
    • Course 1: What Is Clean Air
    • Course 2: The Effects of Air Pollution on Health
    • Course 3: How does an air quality sensor work
    • Course 4: How do we interpret data from school sensors?
    • Course 5: How to Ventilate a Classroom Properly
    • Course 6: How to Breathe Better Air at School and at Home
    • Course 7: How Our Daily Actions Pollute the Air
    • Course 8: What Is Environmental Responsibility
  • Schools
    • Cluj-Napoca
      • ‘George CoÈ™buc’ National College
      • ‘Tiberiu Popoviciu’ High School of Computer Science
      • ‘Lucian Blaga’ Theoretical High School
      • ‘Iuliu HaÈ›ieganu’ Secondary School
  • Community
    • Recent posts
    • Forums
    • Contact
  • Members
logotype
Login
Login
Register
logotype

Lost your password?

Account Details

Profile Details

Name (necesar)

This field can be seen by: Fiecare

logotype
  • General Info
    • About project
    • About Us
  • Courses
    • Course 1: What Is Clean Air
    • Course 2: The Effects of Air Pollution on Health
    • Course 3: How does an air quality sensor work
    • Course 4: How do we interpret data from school sensors?
    • Course 5: How to Ventilate a Classroom Properly
    • Course 6: How to Breathe Better Air at School and at Home
    • Course 7: How Our Daily Actions Pollute the Air
    • Course 8: What Is Environmental Responsibility
  • Schools
    • Cluj-Napoca
      • ‘George CoÈ™buc’ National College
      • ‘Tiberiu Popoviciu’ High School of Computer Science
      • ‘Lucian Blaga’ Theoretical High School
      • ‘Iuliu HaÈ›ieganu’ Secondary School
  • Community
    • Recent posts
    • Forums
    • Contact
  • Members
How do we interpret data from school sensors?
HomeHow do we interpret data from school sensors?

🎯 Learning Objectives:

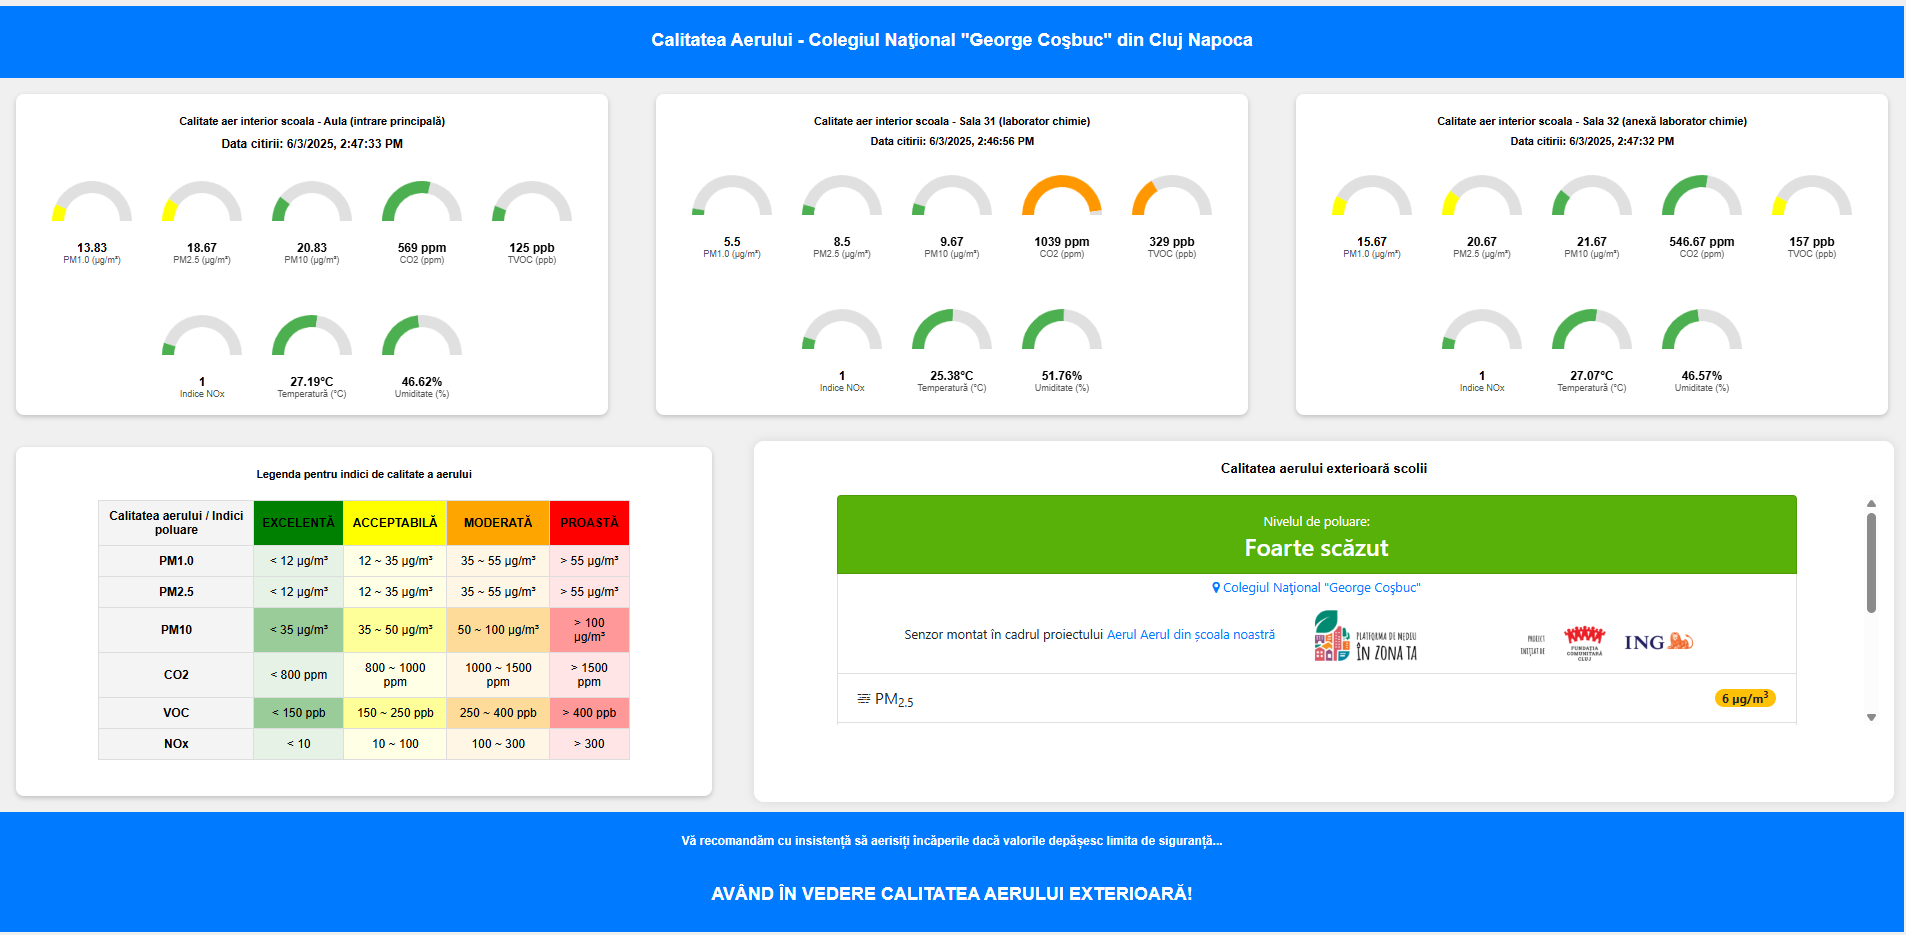
  • Students will learn how to read values from air sensors installed in their classroom or accessed online.

  • Understand measurement units and what defines safe vs. harmful levels.

📚 Lesson Content:

  • Units of measurement:

    • ppm (parts per million) – used for gases like COâ‚‚

    • µg/m³ (micrograms per cubic meter) – used for particulate matter (PM)

  • Safe limit examples (WHO or national recommendations):

    • COâ‚‚: optimal < 1000 ppm

    • PM2.5: safe < 15 µg/m³ (daily average)

  • How values are displayed: graph, LED indicator, or app interface (red = poor, green = good)

🧠 Fun fact: High PM2.5 levels in the morning can be caused by traffic or nearby wood-burning stoves.

🧩 Interactive Activity:

  • Real data analysis: Students receive a graph of COâ‚‚ and PM2.5 values measured over a day in a classroom.

    • Questions: When is the COâ‚‚ peak? What can be done to reduce it?

  • Alternatively: use live sensor data from their own school (if available).

Copyright © 2025 -IOT4NATURE

  • Facebook